
But will Bitcoin yield to the desires of investors? This on-chain analysis aims to explore different possibilities.
Bitcoin still remains undervalued
Bitcoin surprised the world last March when it reached its all-time high of $73,750. That’s because the record price was reached before the halving. Especially since this is only the first time in BTC history that something like this has happened. Currently, the price of the first cryptocurrency is 14% below this peak.
Over the past few weeks, the price of Bitcoin has temporarily fallen below $50,000. However, with a return above $63,000, the data shows that the uptrend could continue. An indicator supporting this bias is the achieved ceiling.
Simply put, the Realized Cap is the total cost of acquiring each Bitcoin in circulation. When the market cap is lower than the Realized Cap, it means that BTC is overvalued. At the time of writing, Bitcoin’s market cap is $1.25 billion.
Learn more: a look back at bitcoin-related price predictions.
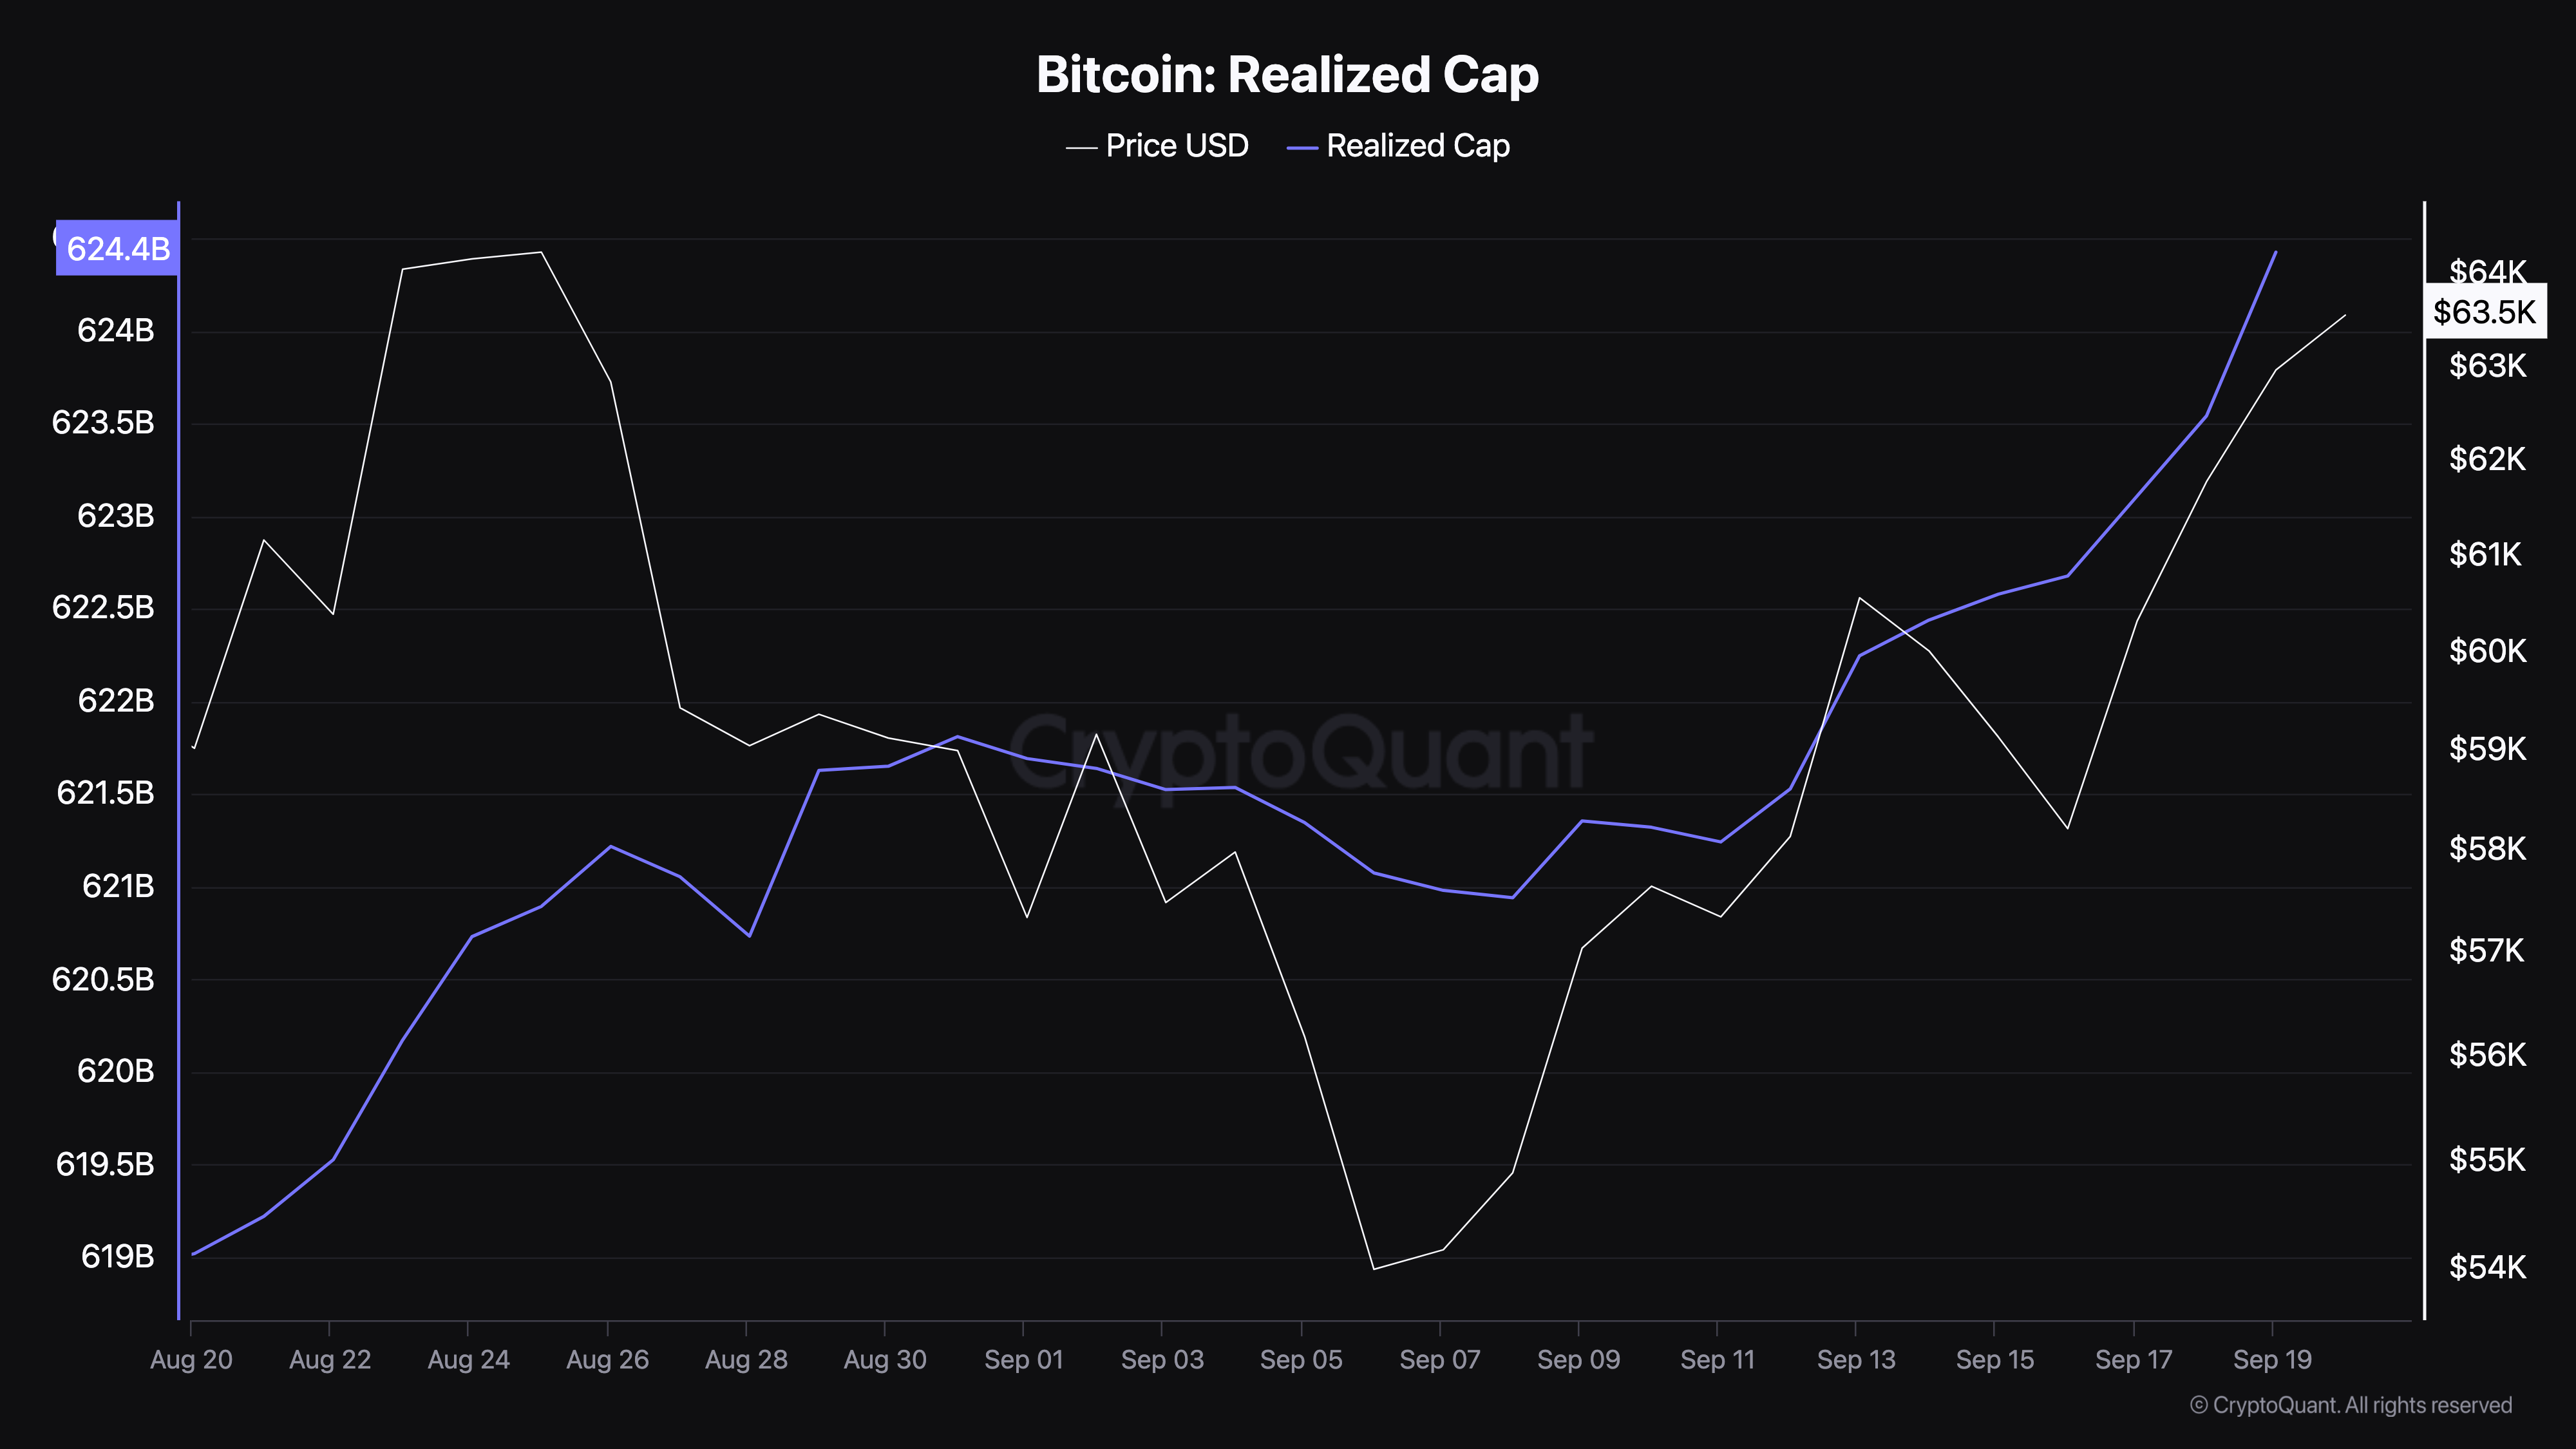
At the same time, the ceiling reached is 624.24 billion USD as mentioned above. This tells us that BTC is undervalued and that the price has the potential to rise.
If this remains unchanged, Bitcoin could reach a new all-time high before the end of 2024. Interestingly, crypto analyst Michaël van de Poppe believes the record is likely to fall soon.
“Bitcoin is following a plan!” I’m looking to see if $66,000 is another resistance before considering a pullback. Overall, I believe we will see a new ATH in October,” van de Poppe wrote on X.
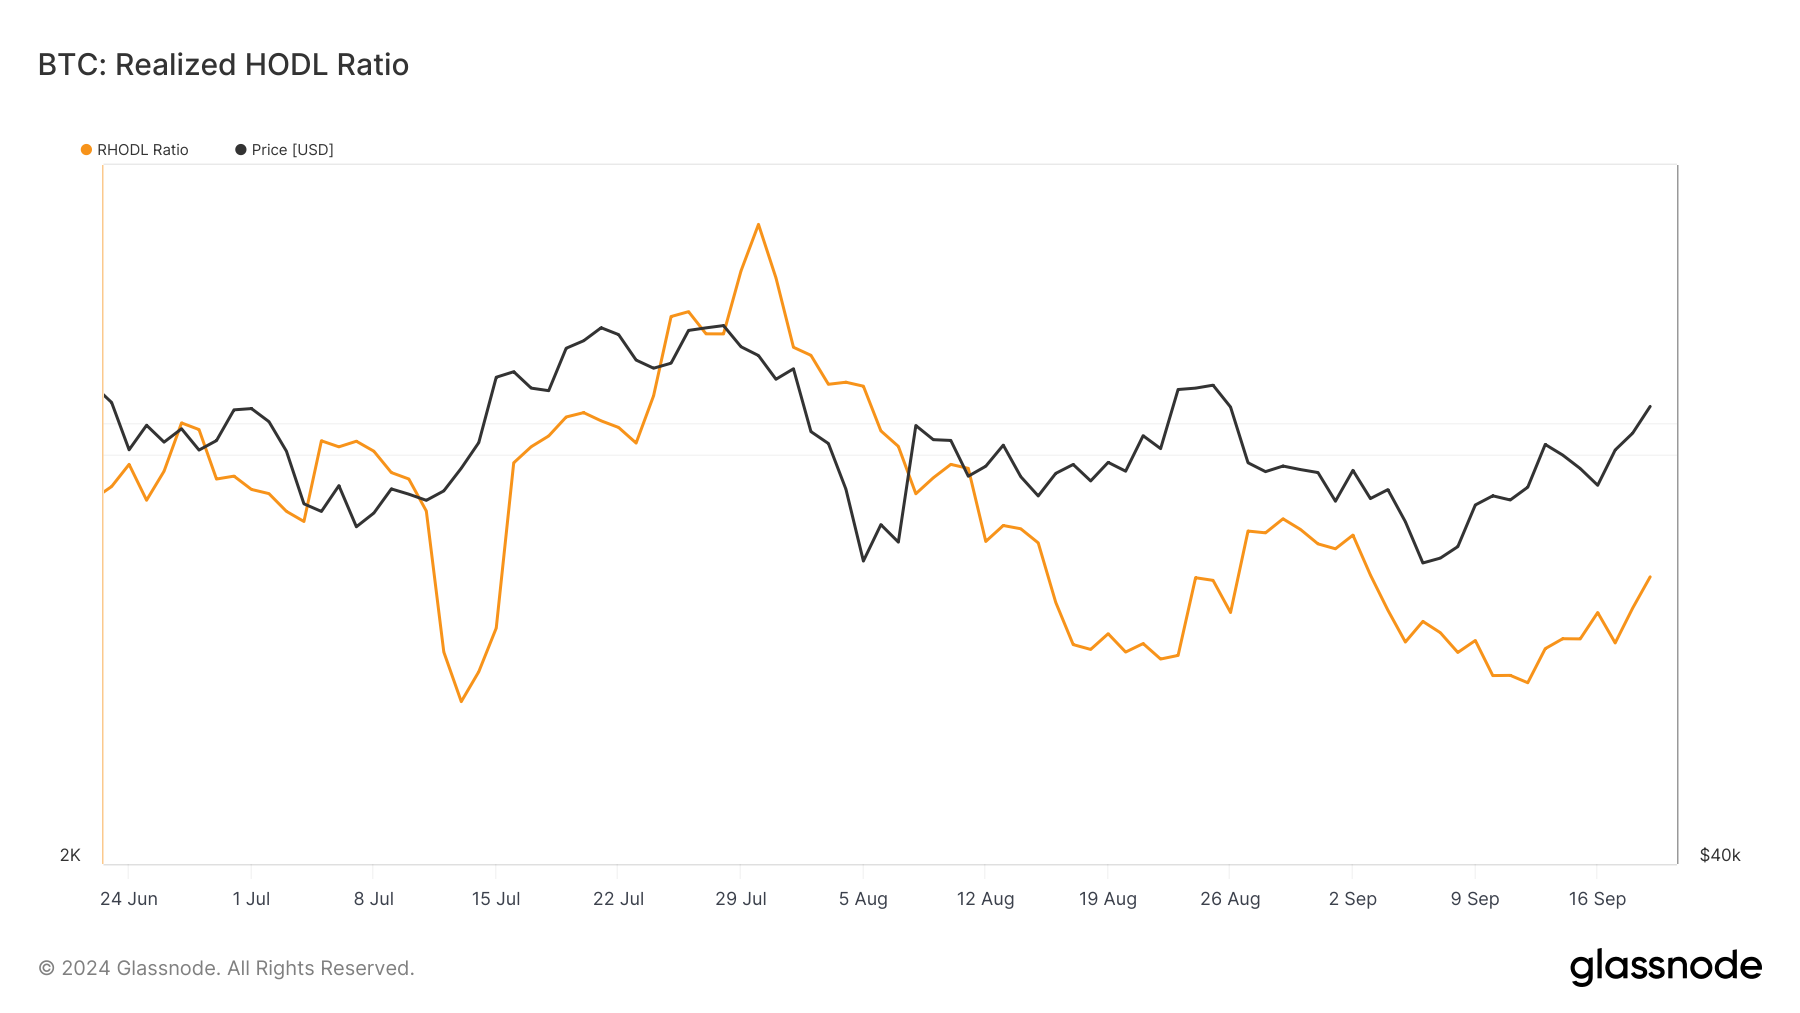
Additionally, the Realized HODL (RHODL) ratio has increased recently. The RHODL ratio shows whether the price of Bitcoin has reached a peak or is at a trough. An extremely high ratio indicates that the cryptocurrency has peaked and a correction may follow as a result.
At the time of writing, however, this ratio is far from overheated. So the recent price hike could be followed by another price hike. Therefore, from the on-chain point of view, the new ATH is close to Bitcoin.
Price Prediction: $70,000 and higher after that
Looking back at the daily chart, we see that the price of BTC has broken above the short-term and long-term exponential moving averages (EMA) for the first time since August. As seen above, the 20-day EMA (blue), 50-day EMA (yellow), and 200-day EMA (purple) are all below BTC. As a reminder, it is currently trading around $63,038.
Historically, the price of BTC has a habit of skyrocketing when this happens. Additionally, the Relative Strength Index (RSI) rose above the resistance last seen in July. This recent level therefore suggests strong bullish momentum for the coin.
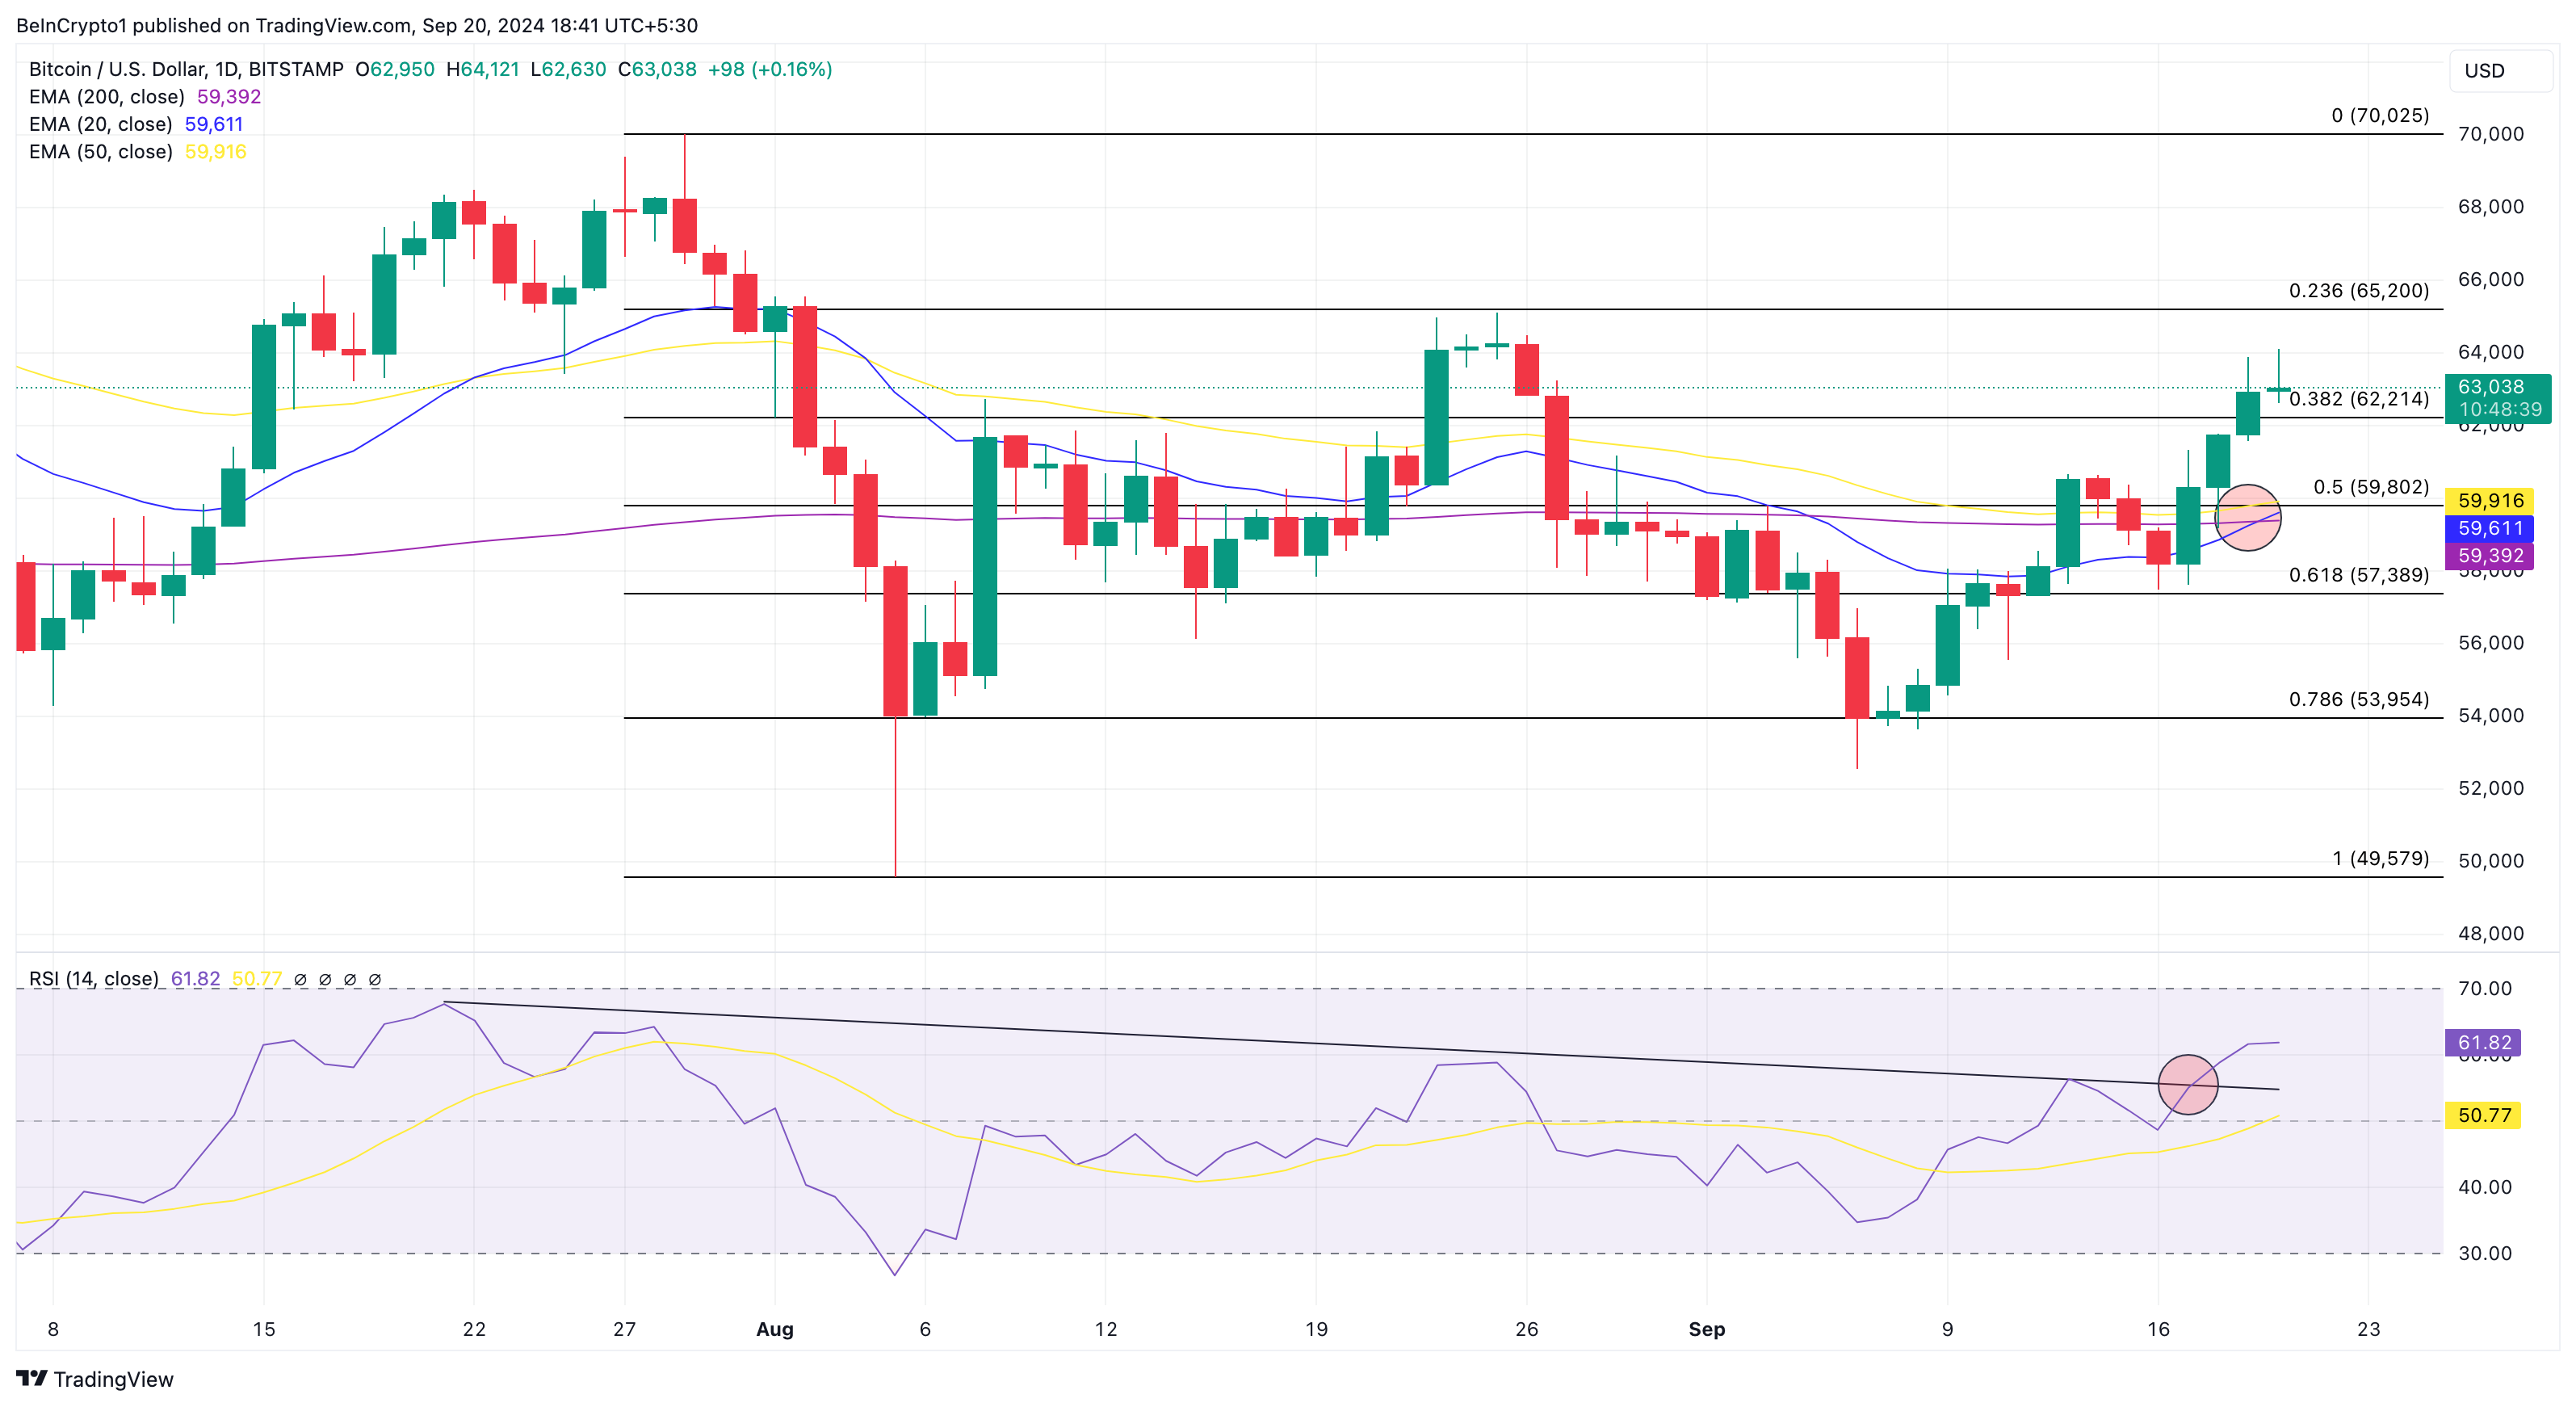
As long as this continues, BTC could reach $70,025 in the coming weeks. If this stance is confirmed, Bitcoin could break above $73,750 and head towards a new ATH by the end of the year.
The main trouble lies at $65,200. If rejected, Bitcoin could drop to $57,389.
Disclaimer
Disclaimer: In accordance with The Trust Project guidelines, this price analysis article is for informational purposes only and should not be considered financial or investment advice. BeInCrypto is committed to providing accurate and unbiased information, but market conditions may change without notice. Always do your own research and consult with an expert before making any financial decision.

